Skip to content
back to the quest log
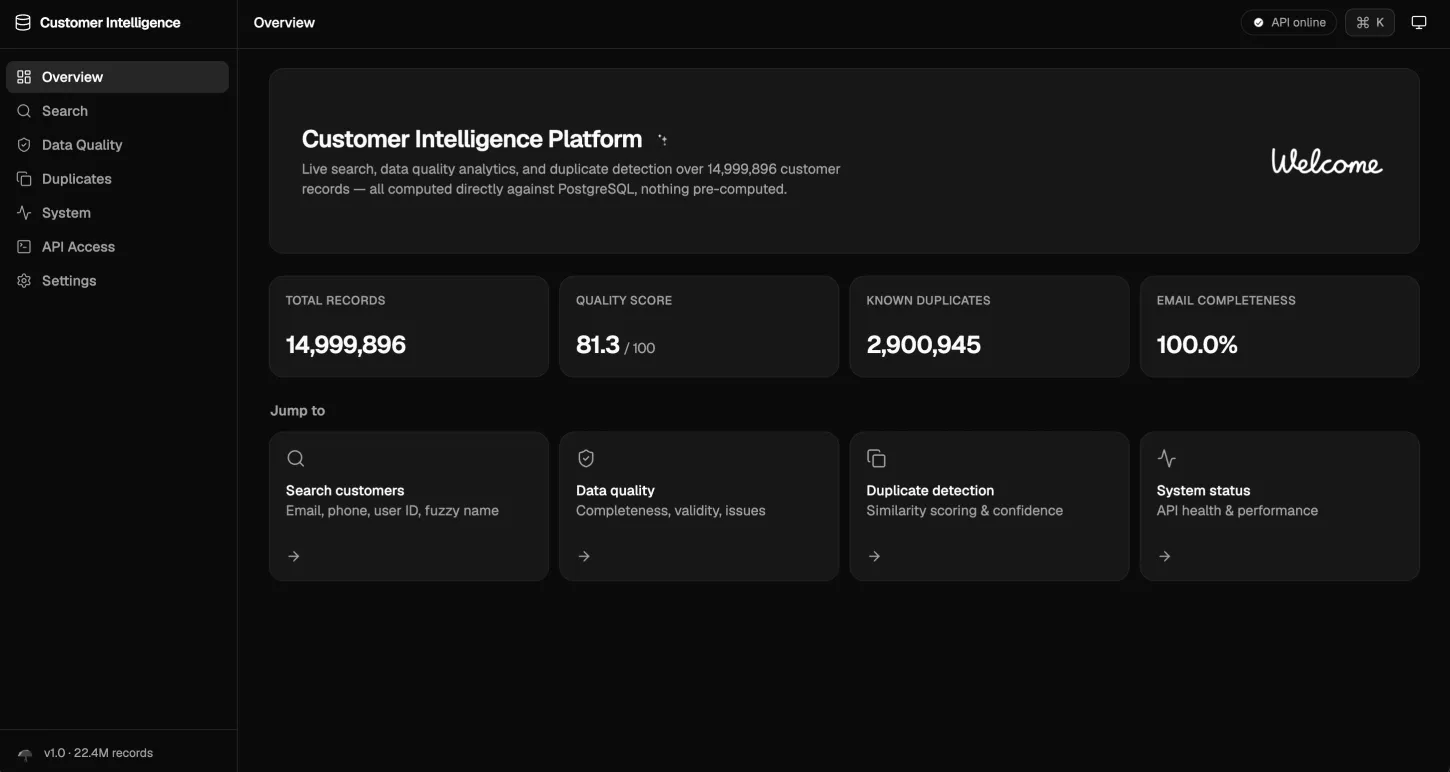
Customer Intelligence overview with record, quality, duplicate, and completeness metrics
legendary◆ productshipped

Customer Intelligence

Fifteen million customers, queried live

A Rust and PostgreSQL operations console for live search, data quality, analytics, and duplicate detection over 22.4 million related records.

role
Solo challenge engineer
org
Four-hour coding challenge
when
2026

What it is

This began as a four-hour coding challenge: turn a 15 million-row customer table and its related activity into a usable operations console on one four-core VPS.

The React client talks to an Axum API backed by SQLx and PostgreSQL 16. Exact lookups use btree indexes, fuzzy names use a trigram GIN index, and expensive analytics refresh through an isolated connection pool into a live snapshot cache.

The result covers customer search, completeness and validity, scored duplicate candidates, growth and revenue analytics, activity heatmaps, system health, an OpenAPI document, and a built-in endpoint explorer.

where the effort went

  • Performance98
  • Data96
  • Product82
  • Operations88

the numbers

Customer rows
15.0M
Related rows
22.4M
Exact search
1-3 ms
Load success
99.2-99.6%

built with

  • Rust
  • Axum
  • SQLx
  • PostgreSQL 16
  • React 19
  • TypeScript
  • Vite
  • Tailwind CSS
  • Nginx
  • Docker
  • Cloudflare

delivery record

What I made

I wanted to show that a very large dataset can stay explorable on modest hardware when query plans, indexes, and background work are treated as product decisions.

  • 01

    Four-mode customer search with pagination, sorting, and query timings

  • 02

    Live completeness, validity, issue, growth, revenue, and activity analytics

  • 03

    Scored duplicate detection with match reasons and confidence bands

  • 04

    Rust API with parameterized SQL, OpenAPI, health probes, and endpoint explorer

  • 05

    Docker deployment behind Nginx and Cloudflare with strict TLS

  • 06

    Twenty-two end-to-end API checks and a documented load-test trail

Hard problems

The constraints mattered as much as the finished interface.

01field note

A query plan that took forty-four seconds

problem
A correlation pattern forced PostgreSQL into work that grew catastrophically on the full dataset.
response
I inspected the plan, changed the access path, and added the supporting normalized and trigram indexes.

Result: The worst query fell from 44 seconds to 0.2 milliseconds in the documented benchmark.

02field note

Analytics competing with interactive search

problem
Full-table aggregates saturated the same CPU and connections needed for user requests during load tests.
response
I separated analytics into its own pool, refreshed it in the background, and served requests from an in-memory snapshot.

Result: Exact indexed searches measured 1 to 3 milliseconds and cached analytics returned in under 1 millisecond.

03field note

Reporting the miss as well as the win

problem
The four-core host reached CPU saturation and missed the target p99 even after maintaining a high success rate.
response
I kept the failed p99 in the report and documented the measured bottleneck rather than smoothing the benchmark.

Result: Load-test success stayed between 99.2 and 99.6 percent, with the remaining capacity limit explicit.

Architecture

Drawn as it was built. Open it full size — the labels are the interesting part.

Screens

In motion

A one-minute pass through search, quality, duplicates, and operations

after shipping

What stayed with me

  • A performance number is only useful when the dataset, hardware, query shape, and failure case travel with it.

  • PostgreSQL can carry both search and analytics at this scale when their workloads are isolated deliberately.